
Rudolf E. Kálmán first formalized the concept of observability in his 1959 paper “On the General Theory of Control Systems”, defining it as “the extent to which the internal state of a system can be inferred based on external outputs.”
The term reappeared at Sun Microsystems in the 1990s, where tools like DTrace were built to monitor and troubleshoot production systems in real time.
In the 2010s, companies like Twitter, Netflix, and Google revived the concept to manage the growing complexity of their large-scale distributed systems, leading to a wave of open-source tools, including Prometheus from SoundCloud, Grafana by Torkel Ödegaard, and InfluxDB and Telegraf by InfluxData, among others.
These tools, designed to collect, store, analyze, and visualize system data, collectively formed what we now recognize as the observability stack.
Seeing vs Understanding
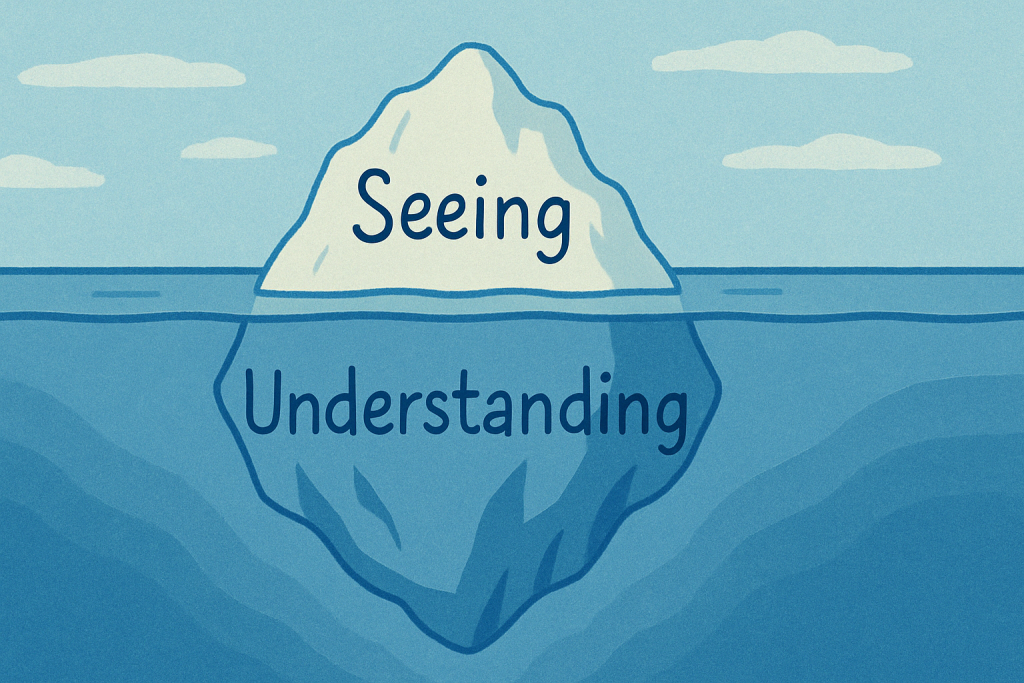
Observability and process visualization serve different but complementary roles in analyzing systems behavior.
Process visualization focuses on real-time representations of operations—showing what is happening now through graphical interfaces that often mimic physical process flows.
Observability takes a broader view, combining metrics, logs, and traces to explain not just what is happening, but why.
If process visualization is an EKG showing your heartbeat in real time, observability is your full medical record that helps explain past patterns, symptoms, and root causes.
The Observability Stack: Components and Tools
Data Collection
Data Collection tools gather information from various sources:
Metrics: Numerical measurements taken at regular intervals. Tools: Telegraf, Collectd.
Logs: Text records of events and activities. Tools: Elasticsearch, Loki.
Traces: Information about requests flowing through systems. Tools: Jaeger, Zipkin, Tempo.
Standards: OpenTelemetry – Unified collection for metrics, logs, and traces.
Data Storage
Data Storage tools are specialized databases optimized for different purposes:
Time-series databases: Efficiently store and query metric data. Tools: Prometheus, InfluxDB, VictoriaMetrics.
Log repositories: Index and search text-based information. Tools: Elasticsearch, Loki.
Distributed tracing systems: Track operations across components. Tools: Jaeger, Zipkin, Tempo.
Visualization and Analysis
Visualization and Analysis tools are platforms that transform data into actionable insights:
Dashboards: Create visual representations of system state. Tools: Grafana, Kibana
Query languages: Enable exploration and analysis of collected data.
Alerting systems: Notify appropriate personnel of anomalies.
Financial and Operational Challenges of Traditional Process Visualization Solutions
Conventional solutions for industrial process visualizations present significant challenges:
In-house systems demand substantial investment to build and maintain, requiring specialized expertise that diverts resources from core business functions. Additionally, in-house teams often lack the experience and time needed for designing and developing secure and reliable software.
Third-party vendor relationships often introduce frustrating delays and rigid frameworks that resist adaptation to changing needs. Many of these vendors are equipment manufacturers who also conduct in-house development with similar limitations, as they are not specialized software companies.
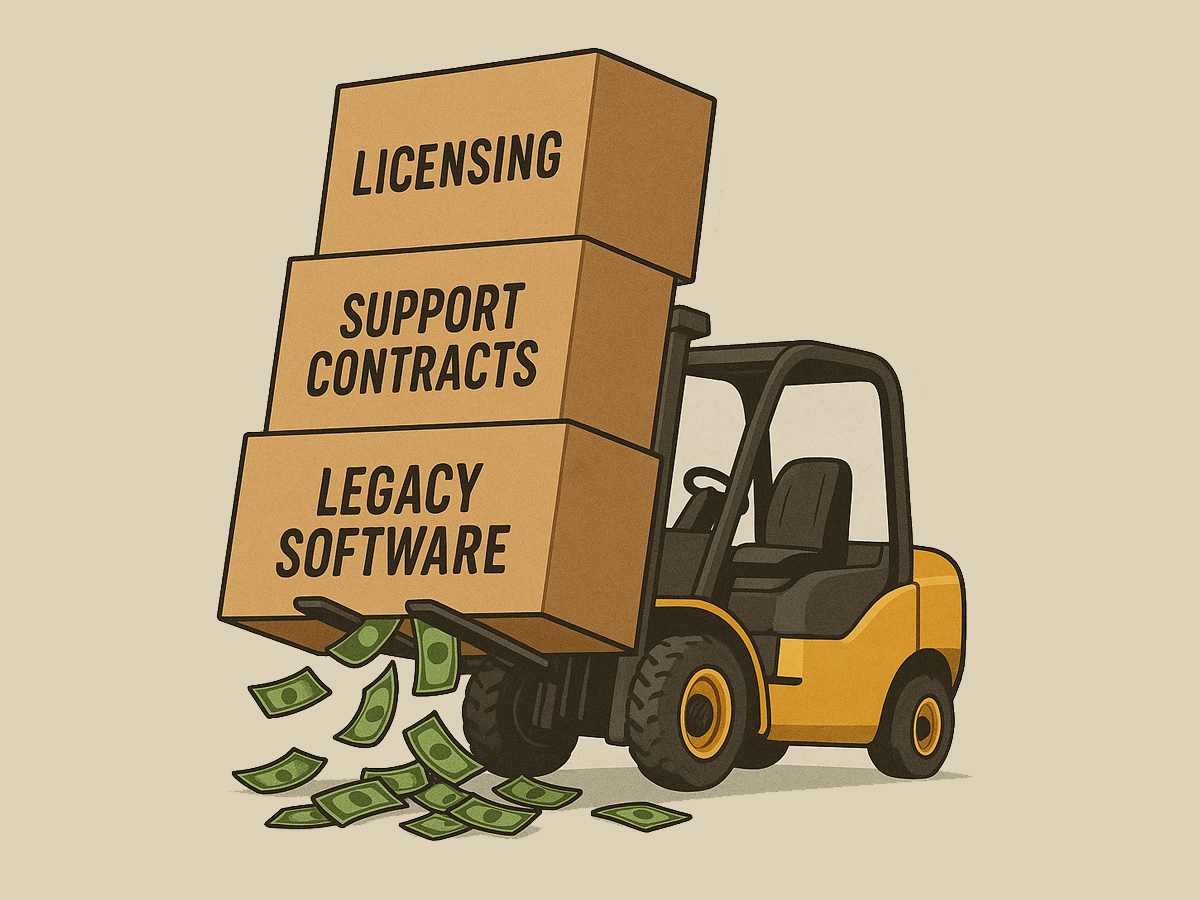
Commercial visualization platforms operate under complex licensing structures that make scaling expensive and foster vendor lock-in. Many of these platforms stem from legacy systems, receiving minimal investment in modernization. As a result, users face outdated solutions built on technological architectures that are literally decades old.
Rethinking the Stack: Observability Tools for Process Visualization
Using the right tool for the job is generally wise—but it’s not an immutable law. Some of the most transformative breakthroughs in technology emerged from applying tools in unconventional ways: Google revolutionized search by scaling with consumer-grade PCs instead of mainframes, while GPUs originally designed for gaming graphics now power the computational backbone of LLMs.
In this spirit of purposeful innovation, enterprise open-source observability tools offer a compelling alternative for industrial process visualization.
Moving Forward
For small and medium industrial operations looking to maximize ROI, open-source observability solutions cost a fraction of proprietary systems while delivering enterprise-grade capabilities. Beyond initial savings, they eliminate restrictive licensing agreements, hardware dependencies, and lengthy procurement cycles when scaling operations
Widely adopted by major corporations across industries, supported by large developer communities, and backed by established open-source service providers, open-source observability tools offer built-in insurance against vendor abandonment and support issues that often plague specialized industrial software.
If you’re looking to gain insights into your operations, we can help. With over 20 years of experience building data and visualization systems for industry, we offer support with the design, integration, and maintenance of open-source observability solutions.
Let’s talk
We would like the opportunity to understand your needs and explore whether this approach is the right fit for your operations.
